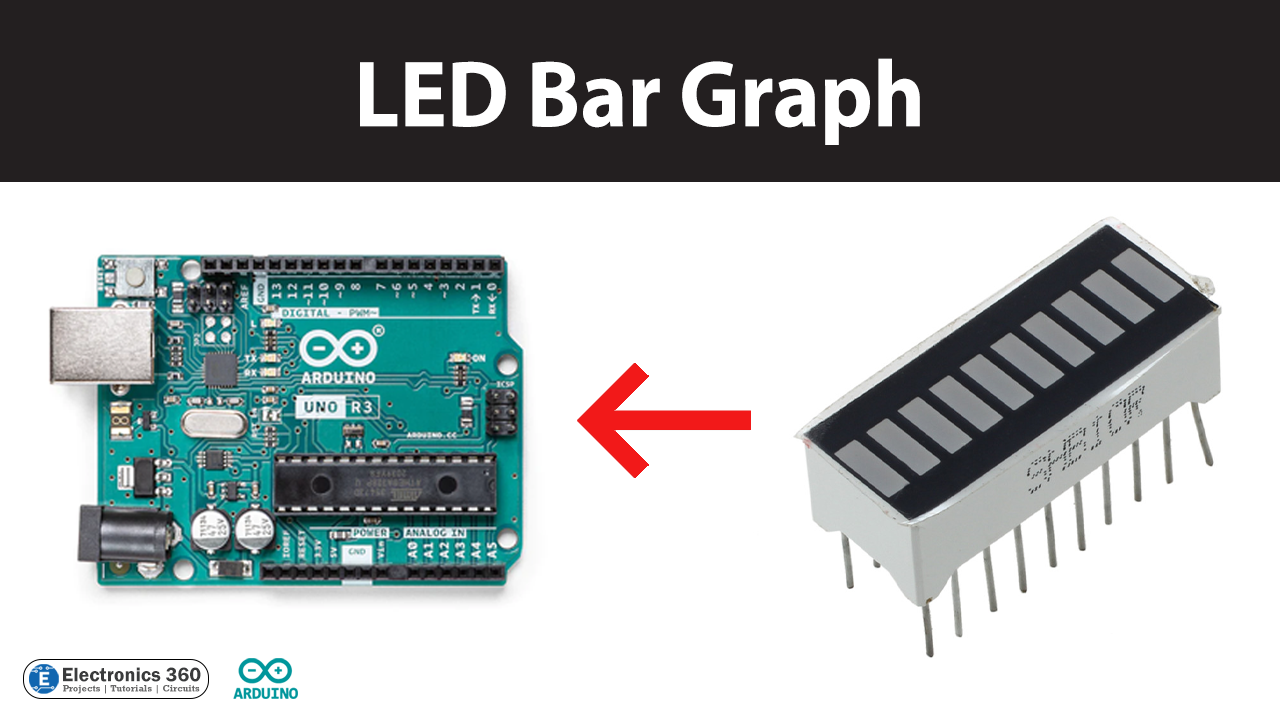
Interfacing LED Bar Graph with Arduino
Introduction
LED bar graphs are a common visual display device used to indicate the status or level of a parameter. They are widely used in various applications such as audio equipment, industrial control systems, and automotive displays.
In this article, we'll explore the steps needed to interface an "LED bar graph with an Arduino", including wiring, coding, and troubleshooting tips.
What is an LED Bar Graph?
An LED bar graph is an array of several light-emitting diodes (LEDs) that are arranged in a line or a matrix-like configuration. It is often used as a visual display of various levels or quantities, such as sound levels, voltage levels, temperature readings, and much more. The LEDs in the bar graph are usually of the same color and brightness, and they can be controlled individually to create different patterns or animations.

Hardware Components
To interface LED Bar graph with Arduino, you'll need the following hardware components to get started:
| Components | Value | Qty |
|---|---|---|
| Arduino UNO | - | 1 |
| USB Cable Type A to B | - | 1 |
| DC Power for Arduino | - | 1 |
| Light Sensor | - | 1 |
| LED Bar | - | 3 |
| Resistor | 220 OHM | 28 |
| Potentiometer | - | 1 |
| Jumper Wires | - | 1 |
LED Bar Graph Pinout

| Pin No. | Pin Name | Description |
|---|---|---|
| 1 to 10 | Anode | All are anode pins of the respected LED |
| 11 to 20 | Cathode | All are cathode pins of the respected LED |
LED Bar Graph Arduino Circuit
Make connections according to the circuit diagram given below.

Installing Arduino IDE
First, you need to install Arduino IDE Software from its official website Arduino. Here is a simple step-by-step guide on "How to install Arduino IDE".
Arduino and LED Bar Graph Example
Now copy the following code and upload it to Arduino IDE Software.
// these constants won't change:
const int ledCount = 8;    // the number of LEDs in the bar graph

int ledPins[] = {
  0, 1, 2, 3, 4, 5, 6, 7
};   // an array of pin numbers to which LEDs are attached


void setup() {
  // loop over the pin array and set them all to output:
  for (int thisLed = 0; thisLed < ledCount; thisLed++) {
    pinMode(ledPins[thisLed], OUTPUT);
  }
}

void loop() {

  // loop over the LED array:
  for (int thisLed = 0; thisLed < ledCount; thisLed++) {
    digitalWrite(ledPins[thisLed], HIGH);
    // wait for 200 ms before you turn off the LED
    delay(200);
    digitalWrite(ledPins[thisLed], LOW);

  }
}
Code Explanation
This Arduino code sets up and controls a basic LED bar graph with eight LEDs. The code begins by defining two constants: ledCount, which specifies the number of LEDs in the bar graph, and ledPins, which is an array of pin numbers that correspond to the individual LEDs in the bar graph.
In the setup() function, the code loops over each pin in the ledPins array and sets it as an output pin using the pinMode() function. This step ensures that the pins are ready to send a signal to the corresponding LEDs.
In the loop() function, the code loops over each LED in the ledPins array and turns it on by setting its corresponding pin to HIGH use the digitalWrite() function. The code then waits for 200 milliseconds using the delay() function before turning the LED off by setting its pin to LOW using digitalWrite(). This process repeats for each LED in the array, resulting in a simple animation of the LED bar graph.
Potentiometer and LED Bar Graph Example

// these constants won't change:
const int analogPin = A0;   // the pin that the potentiometer is attached to
const int ledCount = 10;    // the number of LEDs in the bar graph

int ledPins[] = {
  2, 3, 4, 5, 6, 7, 8, 9, 10, 11
};   // an array of pin numbers to which LEDs are attached


void setup() {
  // loop over the pin array and set them all to output:
  for (int thisLed = 0; thisLed < ledCount; thisLed++) {
    pinMode(ledPins[thisLed], OUTPUT);
  }
}

void loop() {
  // read the potentiometer:
  int sensorReading = analogRead(analogPin);
  // map the result to a range from 0 to the number of LEDs:
  int ledLevel = map(sensorReading, 0, 1023, 0, ledCount);

  // loop over the LED array:
  for (int thisLed = 0; thisLed < ledCount; thisLed++) {
    // if the array element's index is less than ledLevel,
    // turn the pin for this element on:
    if (thisLed < ledLevel) {
      digitalWrite(ledPins[thisLed], HIGH);
    }
    // turn off all pins higher than the ledLevel:
    else {
      digitalWrite(ledPins[thisLed], LOW);
    }
  }
}
Code Explanation
This Arduino code sets up and controls an LED bar graph with ten LEDs, where the brightness of the LEDs is controlled by a potentiometer. The code begins by defining three constants: analogPin, which specifies the pin to which the potentiometer is attached, ledCount, which specifies the number of LEDs in the bar graph, and ledPins, which is an array of pin numbers that correspond to the individual LEDs in the bar graph.
In the setup() function, the code loops over each pin in the ledPins array and sets it as an output pin using the pinMode() function. This step ensures that the pins are ready to send a signal to the corresponding LEDs.
In the loop() function, the code first reads the value of the potentiometer attached to the analogPin using the analogRead() function. The code then maps the value of the potentiometer reading to a range of 0 to the number of LEDs using the map() function. This mapping process converts the analog value into a corresponding number of LEDs that should be turned on, providing a visual representation of the potentiometer reading.
The code then loops over each LED in the ledPins array and turns on the corresponding LEDs by setting their corresponding pin to HIGH using the digitalWrite() function. The number of LEDs turned on depends on the ledLevel value obtained from the mapping process. The code then turns off all remaining LEDs that are not needed by setting their corresponding pins to LOW. This process repeats continuously, allowing the LED bar graph to change the brightness according to the potentiometer reading.
LED Bar Graph and Light Sensor Example

// These constants should match the photoresistor's "gamma" and "rl10" attributes
const int sensorPin = A0; // Set pin of the Photoresistor sensor
const float GAMMA = 0.7;
const float RL10 = 50;
const int ledCount = 10;  // Set number of LEDs in the bar graph

// Array of pins for LEDs in the bar graph
int ledPins[] = {
  2, 3, 4, 5, 6, 7, 8, 9, 10, 11
};

void setup() {
  // Loop over the LEDs pins and set all to output
  for (int thisLed = 0; thisLed < ledCount; thisLed++) {
    pinMode(ledPins[thisLed], OUTPUT);
  }
}

void loop() {
  // Read the Photoresistor sensor value
  int sensorReading = analogRead(sensorPin);

  // Convert the analog value into lux value
  float voltage = sensorReading / 1024. * 5;
  float resistance = 2000 * voltage / (1 - voltage / 5);
  float lux = pow(RL10 * 1e3 * pow(10, GAMMA) / resistance, (1 / GAMMA));

  // Map the result to a range from lux to the number of LEDs
  int ledLevel = map(lux, 0, 1023, 0, ledCount);

  // Loop over the LEDs pins and set element
  for (int thisLed = 0; thisLed < ledCount; thisLed++) {
    // If the array element's index is less than ledLevel
    if (thisLed < ledLevel) {
      // Turn the pin for this element on
      digitalWrite(ledPins[thisLed], HIGH);
    } else {
      // Turn off all pins higher than the ledLevel
      digitalWrite(ledPins[thisLed], LOW);
    }
  }
}
Code Explanation
This Arduino code is an example of how to interface a photoresistor sensor with a bar graph of LEDs. The photoresistor sensor's pin is defined as A0 and its corresponding "gamma" and "rl10" attributes are defined as constants GAMMA and RL10 respectively. The number of LEDs in the bar graph is defined as ledCount, and an array of pin numbers to which LEDs are attached is created and assigned to ledPins.
In the setup function, the pins of the LEDs are set to output mode. In the loop function, the analog value from the photoresistor sensor is read, converted to lux value, and mapped to a range from 0 to the number of LEDs. The lux value is calculated using the resistance and voltage values obtained from the sensor reading.
Then, the loop function checks each element of the ledPins array and turns on the pins corresponding to elements with an index lower than ledLevel. The pins corresponding to elements with an index higher than the ledLevel are turned off. This results in a bar graph display of the measured lux value on the LED bar graph.
Applications
Here are some applications of LED bar graph:
- Audio level meters for sound equipment
- Battery level indicators
- Light intensity meters
- VU (Volume Unit) meters for music players and mixing consoles
- Signal strength meters for wireless communication devices
- Progress bars for loading and buffering on display screens
- Visual feedback for monitoring sensor data in real-time
- Power output meters for generators and solar panels
- Fuel level indicators for vehicles and machinery.
Conclusion.
LED bar graph with Arduino is a fun and educational project that provides a hands-on introduction to the world of microcontrollers and digital electronics. By following the simple steps outlined in this article, beginners can learn how to control LEDs and create various visual displays using an Arduino board.
Comments 0
Be the first to comment.
Leave a comment